Sources: Taiwan Customs import statistics / Industry reports
Publication date: August 11, 2026
Introduction: Lower Volume and Higher Prices in July, but the Price Signal Is More Than an Average
Taiwan imported a combined 13,687 metric tons of carbon steel round bar and alloy steel round bar in July 2026, down 30% from June but up 2% from the same month last year. The weighted average CIF price rose from USD 741 per metric ton in June to USD 807, an increase of about 9% month over month and about 11% year over year. On the surface this is a textbook case of falling volume and rising prices. Origin-country data, however, show that the higher average reflects both a change in the mix of supplying countries and price movements within each source, and therefore cannot be read directly as a broad market price increase.
Japan's share of carbon steel round bar imports jumped from 28% in June to 79% in July, while China's share fell from 66% to 16%. Alloy steel round bar followed the same pattern, with Japan replacing China as the largest source in July. Japanese material carries a higher unit price than Chinese material, so a switch in origin pulls the weighted average upward. An approximate decomposition based on origin shares and average prices suggests that roughly 80% of the June-to-July increase in the overall steel bar average price is attributable to the change in origin weights, with the remainder coming from price movements within individual sources. This is an estimate of the structural effect and does not imply that individual transaction prices were unchanged.
The previous edition raised two hypotheses to be tested against July data: first, whether June's rebound in carbon steel volume would continue; second, whether South Korea would keep expanding its share of alloy steel round bar. The answers are now clearer. The June rebound did not carry through — carbon steel imports fell 33% month over month in July, though they remained 19% above the year-earlier level. South Korean alloy steel round bar imports for January–July rose 76% year over year, lifting their share from 10.9% to 17.5%. The data show that the high second-quarter arrival volume cooled in July, and the focus of analysis has shifted from aggregate volume to the reordering of supply sources and price structure.
1. Market Overview: A Marked Cooling in July After Passing 100,000 Metric Tons
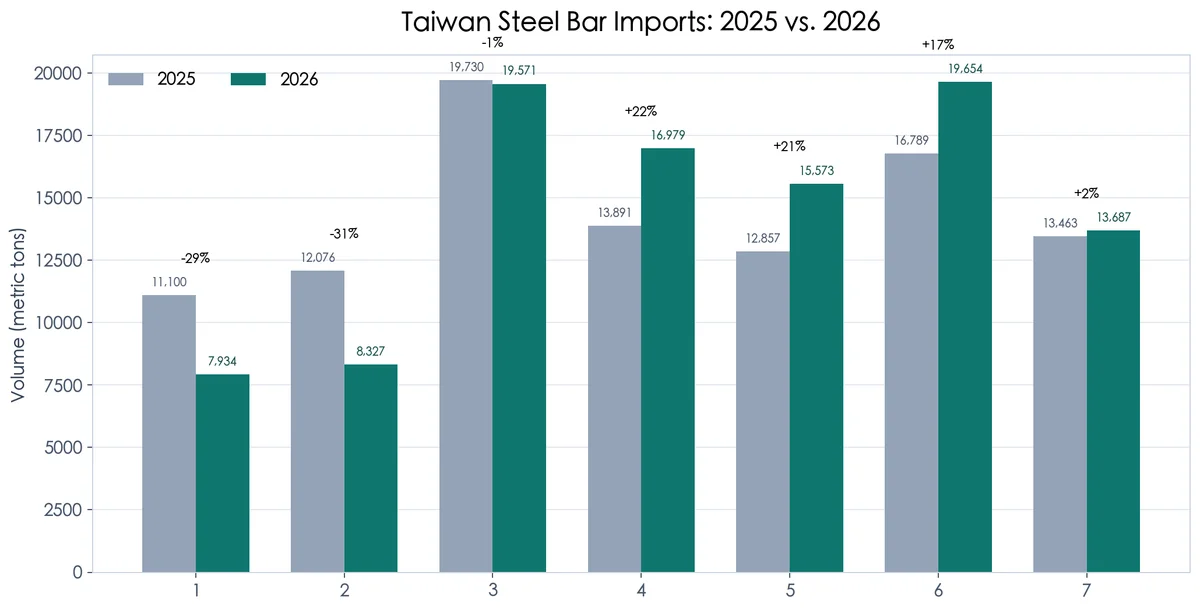
(Monthly steel bar import volume, January–July 2026)
Combined imports of the two steel bar categories totalled 101,726 metric tons in January–July 2026, up 1.8% from 99,906 metric tons a year earlier. Import value was USD 74.289 million, down 1.6% from USD 75.533 million, and the weighted average CIF price fell 3.4% from USD 756 to USD 730 per metric ton. Notably, the rising share of higher-priced alloy steel round bar should in theory support the overall average price. That the aggregate average nevertheless declined indicates that downward price pressure within each category — particularly carbon steel round bar — was stronger still.
Alloy steel round bar accounted for 71,190 metric tons, or 70% of the total, and carbon steel round bar for 30,536 metric tons, or 30%. The alloy share was 65.1% in the same period last year, so it has risen by nearly five percentage points and the market has moved further toward alloy-led demand.
The monthly trajectory falls into four stages: low volume in January and February, a rapid increase in March, a sustained high level from April through June, and a decline in July. Both March and June came close to 20,000 metric tons, but July fell to 13,687 metric tons, 5,967 metric tons below June. Carbon steel and alloy steel declined together, confirming that the fall was not driven by a single category. Customs arrival data alone, however, cannot distinguish among restocking cycles, shipping schedules, and changes in underlying demand.
Cross-year monthly comparison shows total volume down 29% and 31% year over year in January and February, roughly flat in March, and up 17% to 22% in each month from April through June, recovering the first-quarter shortfall. July was only 2% above the same month last year, indicating that the strong second-quarter increment did not continue. In other words, the cumulative 1.8% gain does not reflect even expansion across the year; it is the result of concentrated volume in the second quarter.
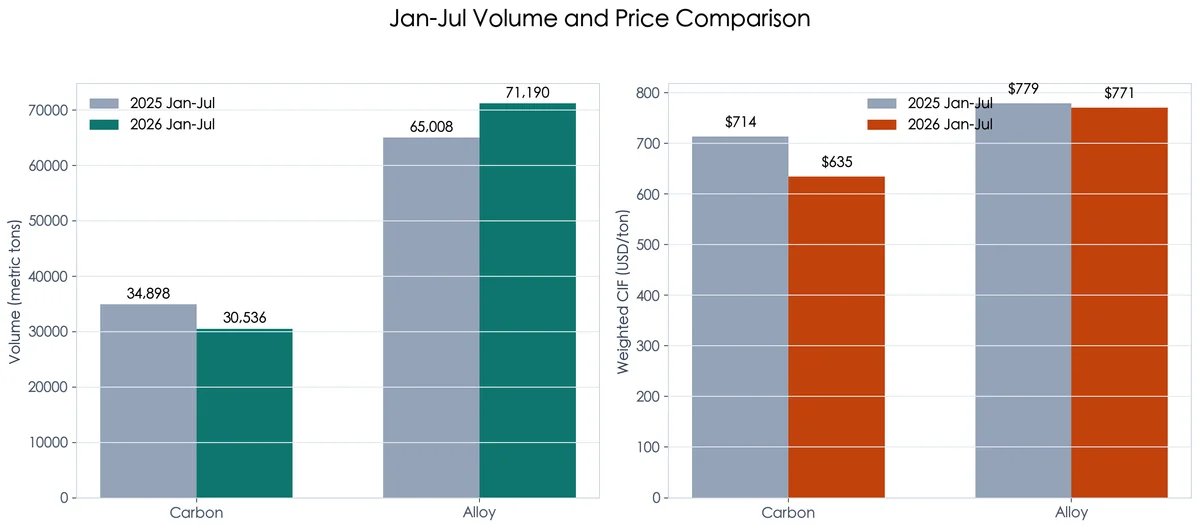
(Steel bar import volume and price comparison, January–July 2025 and 2026)
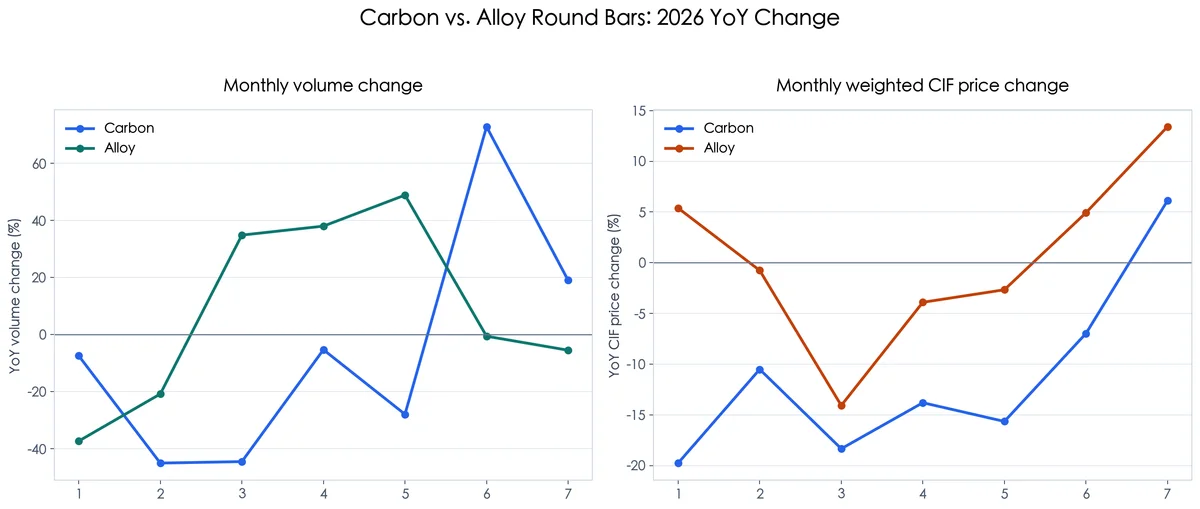
(Year-over-year monthly change in carbon steel and alloy steel round bar)
2. Carbon Steel Round Bar: The June Rebound Did Not Continue, and Japanese Material Reset July Prices
Monthly Volume and Price
Cumulative carbon steel round bar imports for January–July 2026 were 30,536 metric tons, down 12.5% year over year, at a weighted average CIF price of USD 635 per metric ton, down 11.1%. July imports were 4,687 metric tons, 33% below June's 6,980 metric tons but 19% above the same month last year. The average price rose from USD 641 to USD 736 per metric ton, up 15% month over month and 6% year over year.
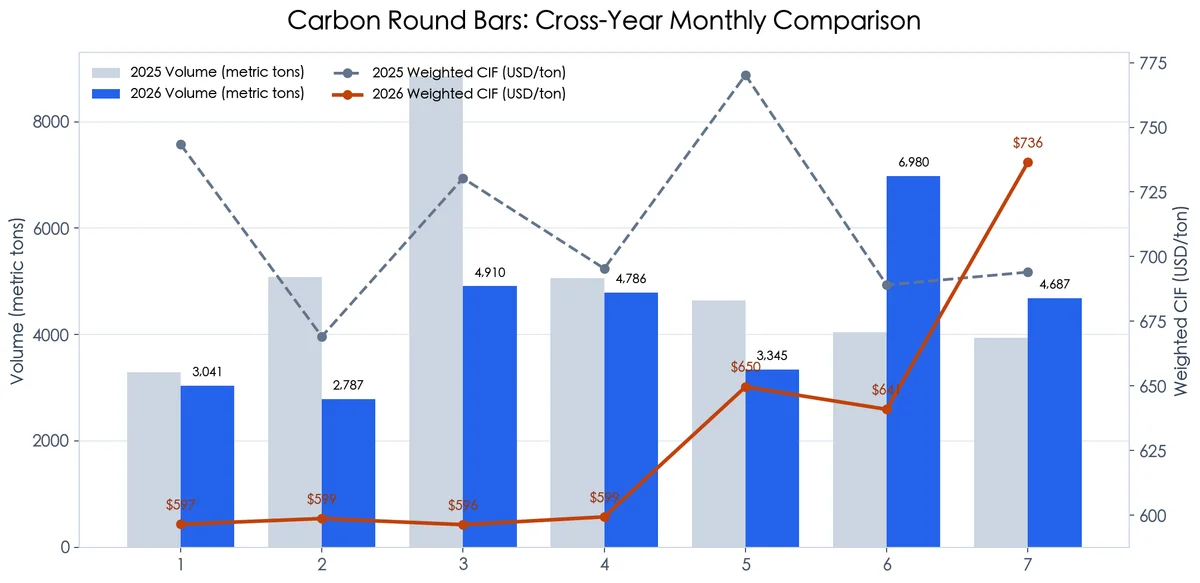
(Carbon steel round bar monthly volume and price, year over year)
This outcome refutes the hypothesis that June's high volume extended into July, but it is not sufficient on its own to determine whether June reflected concentrated arrivals, restocking, or a temporary improvement in end-user demand. July remained above the year-earlier level, so carbon steel has not returned to the sharp contraction seen at the start of the year. The appropriate test is whether import volume stays above year-earlier levels for several consecutive months, rather than judging demand from a single month.
The price increase likewise has more than one cause. In July the average price of Chinese carbon steel round bar was about USD 642 per metric ton and Japanese material about USD 745, up roughly 8% and 11% respectively from June. At the same time, Japanese import volume rose from 1,976 to 3,700 metric tons while Chinese volume fell from 4,574 to 747 metric tons. An approximate decomposition attributes about 45% of the increase in the carbon steel average price to the change in origin mix and about 55% to price movements within sources. Should China's share recover in August, the overall average price could fall back on mix effects alone, but this must be read alongside quotations from each source.
Origin Structure Year Over Year
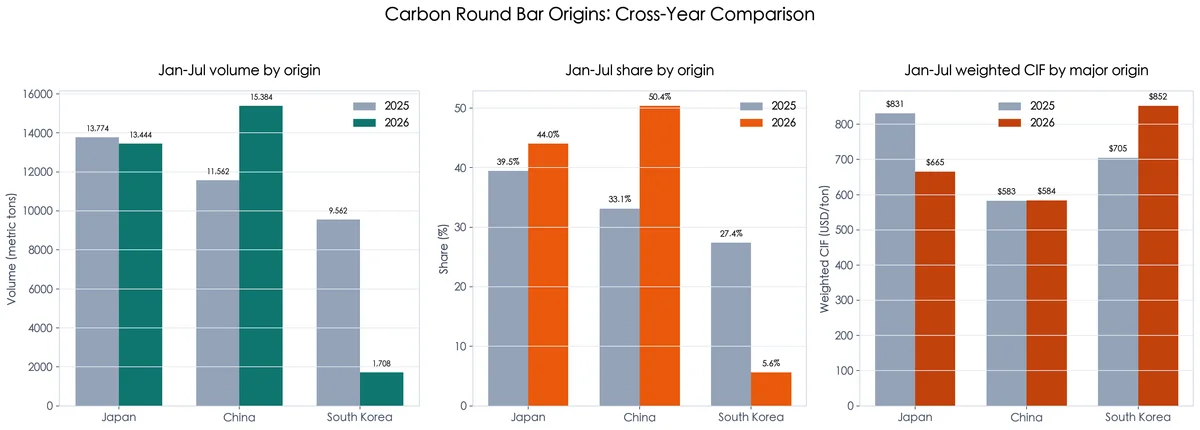
(Carbon steel round bar import volume, share, and average price by origin)
Chinese carbon steel round bar imports for January–July rose 33% from 11,562 to 15,384 metric tons, lifting China's share from 33.1% to 50.4%. Japan edged down from 13,774 to 13,444 metric tons, yet its share rose from 39.5% to 44.0%. South Korea fell 82% from 9,562 to 1,708 metric tons, with its share contracting from 27.4% to 5.6%.
Total carbon steel volume declined by 4,361 metric tons while South Korean volume alone fell by 7,854 metric tons; the 3,822-metric-ton increase from China offset nearly half of the gap. This indicates that this year's carbon steel market reflects not only a change in aggregate demand but also a pronounced substitution of supply sources. Japanese volume was broadly flat, but its cumulative average price fell from USD 831 per metric ton last year to USD 665, narrowing the gap with Chinese material from USD 248 to USD 81. The data confirm that price convergence and share reallocation occurred together, though customs data alone cannot establish the pricing intent of Japanese suppliers.
3. Alloy Steel Round Bar: The High-Volume Plateau Broke, and Japan Became the Largest July Source
Monthly Volume and Price
Cumulative alloy steel round bar imports for January–July 2026 were 71,190 metric tons, up 9.5% year over year, at a weighted average CIF price of USD 771 per metric ton, down only 0.9%. Alloy steel accounted for about 70% of combined steel bar volume, above 65% a year earlier, and was the only source of cumulative growth in this year's import market.
July imports were 9,000 metric tons, down 29% from June and 5.5% from the same month last year, ending four consecutive months from March to June above 12,000 metric tons. The average price rose from USD 796 to USD 843 per metric ton, up 6% month over month and 13.4% year over year, the highest level so far this year.
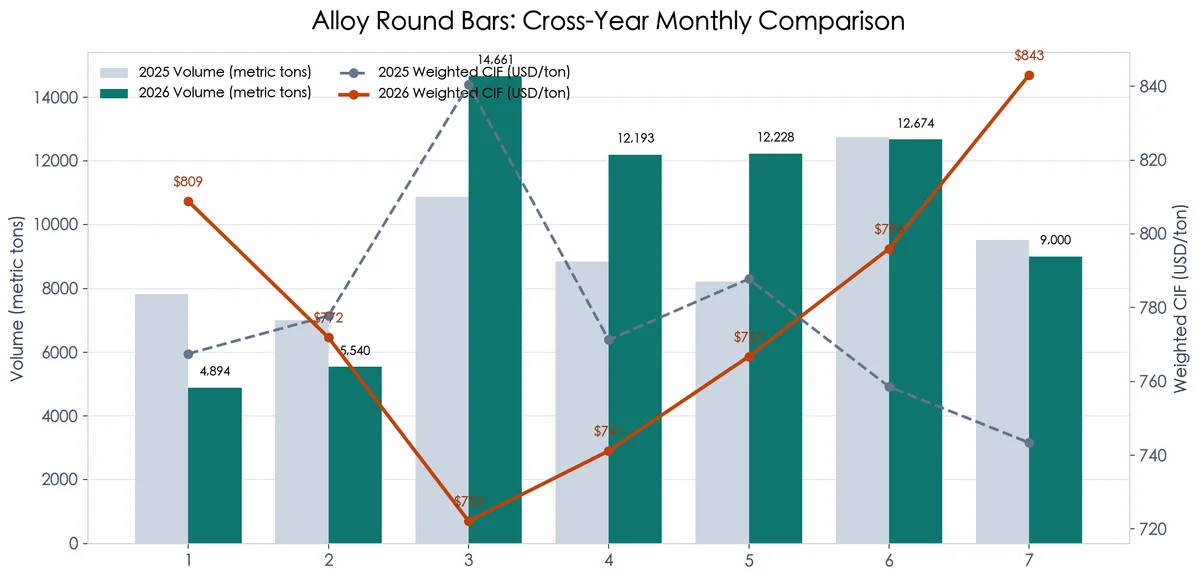
(Alloy steel round bar monthly volume and price, year over year)
The elevated volumes after March were clearly not a one-month anomaly, but the July decline shows that the plateau above 12,000 metric tons has not been sustained. Only if subsequent months stay below 10,000 metric tons would the view that March–June represented a temporary high-volume phase gain further support; July alone is not enough to confirm that the restocking cycle has ended.
Origins: South Korea Provided Most of the Year-Over-Year Growth
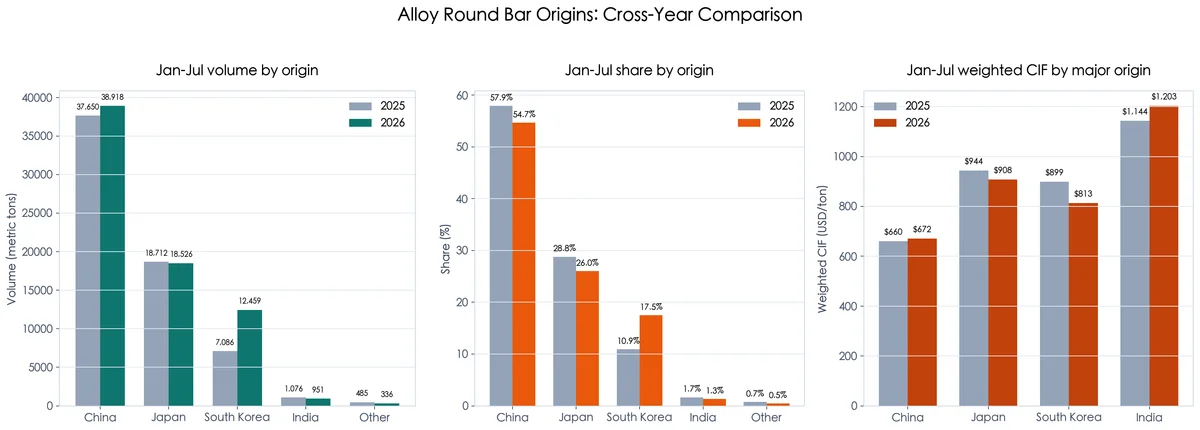
(Alloy steel round bar import volume, share, and average price by origin)
Chinese alloy steel round bar imports for January–July rose 3% from 37,650 to 38,918 metric tons, but China's share fell from 57.9% to 54.7%. Japan edged down from 18,712 to 18,526 metric tons, with its share falling from 28.8% to 26.0%. South Korea rose 76% from 7,086 to 12,459 metric tons, lifting its share from 10.9% to 17.5%.
Total alloy steel volume increased by 6,182 metric tons, of which South Korea contributed 5,373 metric tons, or about 87% of the net gain. South Korea's cumulative average price fell from USD 899 to USD 813 per metric ton, between China's USD 672 and Japan's USD 908. Its share expanded materially while its price settled into the middle of the range, making South Korea the most important variable in this year's alloy supply structure. The two developments are related, but order and specification data would be required to confirm that price is the direct driver.
Within July alone, however, the largest source was Japan. Japanese imports rose from 2,915 metric tons in June to 3,902 metric tons, or 43.4% of July alloy steel imports. China fell from 6,728 to 3,194 metric tons, a 35.5% share, and South Korea fell from 2,902 to 1,806 metric tons, a 20.1% share.
Japan's July average price of about USD 974 per metric ton was well above China's USD 655 and South Korea's USD 836. An approximate decomposition indicates that the shift in origin mix from China to Japan explains almost the entire month-over-month increase in the alloy steel average price; within-source price movements largely offset one another, with Japan rising and China falling. Low-price supply pressure has therefore not disappeared, and July's higher average price should not be extrapolated into a uniform strengthening across all sources.
4. Market Intelligence: Rising Imports, the Asian Off-Season, and Trade Remedies at the Same Time
4.1 Broader Bar Steel Imports Rose While Prices Stayed Low
On a broader bar steel statistical basis, imports in the first half of 2026 reached 203,555 metric tons, up 29% year over year, while import prices fell by NTD 1,569 per metric ton from a year earlier. That series covers a wider scope than the two HS codes in this report, so the figures are not directly comparable, but the direction is consistent: the main pressure on this year's market is not insufficient imports but rising import volume alongside falling prices.
For the two categories covered here, January–July volume rose 1.8% while the average price fell 3.4%, likewise reflecting supply competition outweighing price support. After July's rebound in average price, it remains to be seen whether this is a single-month fluctuation driven by origin mix or the start of a broader increase in actual transaction prices.
4.2 Chinese Long Products Remained Under Off-Season Pressure
Prices for China's five major steel products weakened across the board in late July, with wire rod and rebar leading the declines. Reports cited high temperatures and heavy rain, slowing growth in property investment, thin transaction volume, and lower coke and iron ore prices as jointly undermining support for long product prices. Mill losses and production cuts limit further downside, but demand has yet to recover meaningfully.
This is directionally consistent with the fall in the average price of Chinese alloy steel round bar imported into Taiwan to about USD 655 per metric ton in July, though product scope and trading terms differ, so it serves as background context rather than direct causal evidence. What can be confirmed is that Chinese material did not lose its price advantage even as Taiwan's overall average price rose. Chinese long product prices and actual quotations to Taiwan should continue to be tracked together.
4.3 Expanding Trade Remedies May Continue to Redirect Asian Trade Flows
Trade remedy cases targeting Chinese wire rod and alloy bar steel increased across Asia and the Americas in July. Thailand imposed provisional anti-dumping measures on Chinese wire rod and anti-circumvention duties on certain high-carbon alloy steel wire rod; Vietnam opened an anti-dumping investigation into Chinese prestressed alloy steel bars, rods, and wire rod; and Mexico initiated an anti-dumping review of Chinese wire rod.
These cases do not necessarily cover every specification imported into Taiwan, but they raise the level of uncertainty around Chinese steel exports. If barriers to entry rise in some markets, material may be redirected toward Asian markets that have not imposed restrictions; Chinese exporters may equally adjust specifications, destinations, and pricing. For Taiwanese buyers, opportunities to secure low-priced material may increase, but supply concentration and downstream trade risk will rise in parallel.
5. Outlook: Track the Origin Mix, Not Just the Average Price
Carbon Steel Round Bar
Cumulative carbon steel volume is down 12.5% year over year, yet July moved above the year-earlier level in both volume and price. The near-term question shifts from the previous edition's "whether June marked the start of sustained restocking" to "whether Japan's high share persists." If China's share recovers while prices at each source hold broadly steady, the carbon steel average price could fall back on mix effects; if Japan remains the principal source, the average price is more likely to hold at a higher level. In either case, shares and within-source prices should be assessed separately.
Alloy Steel Round Bar
The March–June high-volume plateau broke in July, but cumulative imports are still up 9.5% year over year. South Korea's 76% increase confirms that its supply chain expansion is not a single-month phenomenon, and Japan became the largest single-month source in July. If Japan's increment comes from higher-grade specifications or specific orders, the combination of lower volume and higher prices may have genuine product demand behind it; if it merely reflects concentrated shipping schedules, both the average price and Japan's share could fall back in August.
Three Indicators to Monitor
-
Carbon steel origin switching: whether monthly Chinese carbon steel imports recover from 747 metric tons, and whether Japan's single-month share stays above 50%.
-
The alloy high-volume plateau: whether August returns to 10,000–12,000 metric tons. Sustained readings below 10,000 metric tons would suggest the second-quarter restocking cycle has ended.
-
Chinese prices and trade flows: whether the average price of Chinese alloy steel round bar holds at USD 650–700 per metric ton, and whether overseas anti-dumping measures push more material toward Taiwan.
6. Conclusion
Combined steel bar volume for January–July 2026 rose just 1.8% year over year, but substantial substitution took place beneath the surface: carbon steel fell 12.5% while alloy steel rose 9.5%; China displaced South Korea in carbon steel, while South Korea supplied most of the growth in alloy steel. Although combined July imports fell 30% from June, Japanese material increased in both categories at once, pushing the overall average price markedly higher. Chinese material retains the lowest-price position, so supply competition has not ended with July's higher average price.
If the next stage of analysis tracks only aggregate volume or average price, mix effects from origin and product composition are easily mistaken for a cyclical turn. The more reliable approach is to monitor the monthly shares and individual CIF prices of China, Japan, and South Korea together, alongside whether alloy steel round bar volume can recover. Confidence in a genuine strengthening of demand and prices will only increase if import volume, actual transactions, and prices from more than one major source improve at the same time.
Read more: Taiwan Steel Bar Import Market Analysis, January-June 2026
This report is compiled by Double Steel Co., Ltd from Taiwan Customs import statistics and covers HS 72149920 and HS 72283000907. Weighted CIF prices are calculated by dividing aggregate import value by aggregate import weight. Under established rules, individual records below 5 metric tons and anomalous entries are excluded. July 2026 figures are preliminary and may be revised. Year-over-year comparisons use the same month and the January–July period of 2025. The decomposition of the June-to-July change in average price uses two-period average weights to approximate the contributions of origin mix and within-source prices. Market commentary is provided for trend analysis only and does not constitute purchasing advice.