Sources: Taiwan Customs import statistics and publicly available industry reports
Publication date: July 10, 2026
Introduction: Alloy Steel Remained Elevated While Carbon Steel Rebounded in June
Taiwan's imports of the two steel bar categories covered by this report continued to show a clear structural divergence in the first half of 2026: alloy steel bars led the market, while carbon steel bars remained comparatively weak. June, however, introduced an important change.
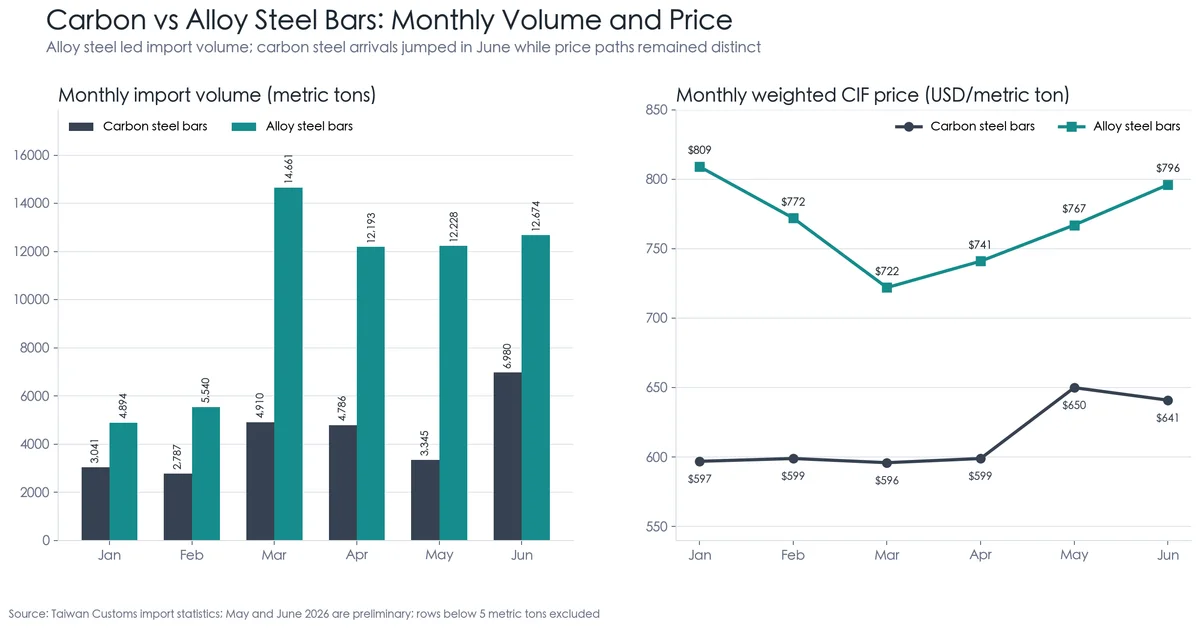
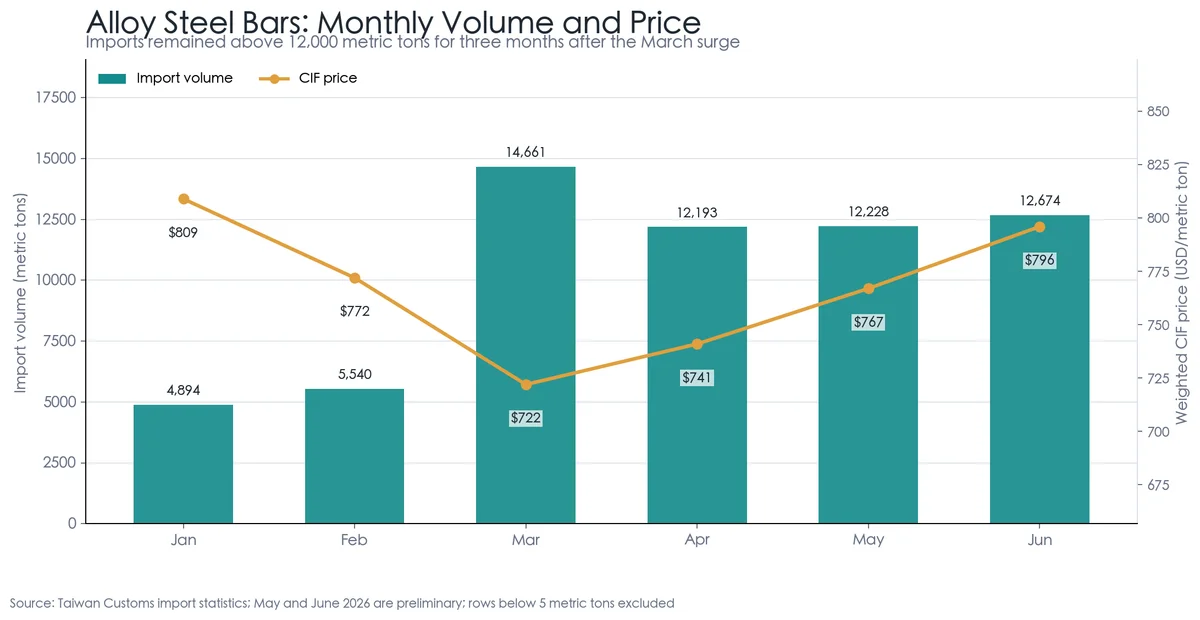
Alloy steel bar imports were low in January and February, surged to 14,661 metric tons in March, and then remained above 12,000 metric tons in each month from April through June. The pattern has therefore progressed from a low point to a sharp surge and then to a sustained high plateau. March can no longer be treated as an isolated shipment spike; restocking, supply-source substitution, or specific downstream orders appear to have supported imports through the end of the second quarter.
Carbon steel bar imports were subdued during the first five months but jumped from 3,345 metric tons in May to 6,980 metric tons in June, the highest monthly level in the first half. The average CIF price nevertheless eased from USD 650 to USD 641 per metric ton. At this stage, the increase looks more like concentrated arrivals or opportunistic low-price restocking than conclusive evidence of a broad recovery in end-user demand.
Three external variables will be central to the third-quarter outlook: whether South Korea's anti-dumping investigation into Chinese round bars redirects regional trade flows, whether China Steel Corporation's third-quarter price increase passes through to actual transactions, and whether Chinese demand and prices rebound after the summer slowdown.
1. Market Overview: Second-Quarter Arrivals Offset the Early-Year Shortfall
 (Taiwan monthly steel bar import volume, January-June 2026)
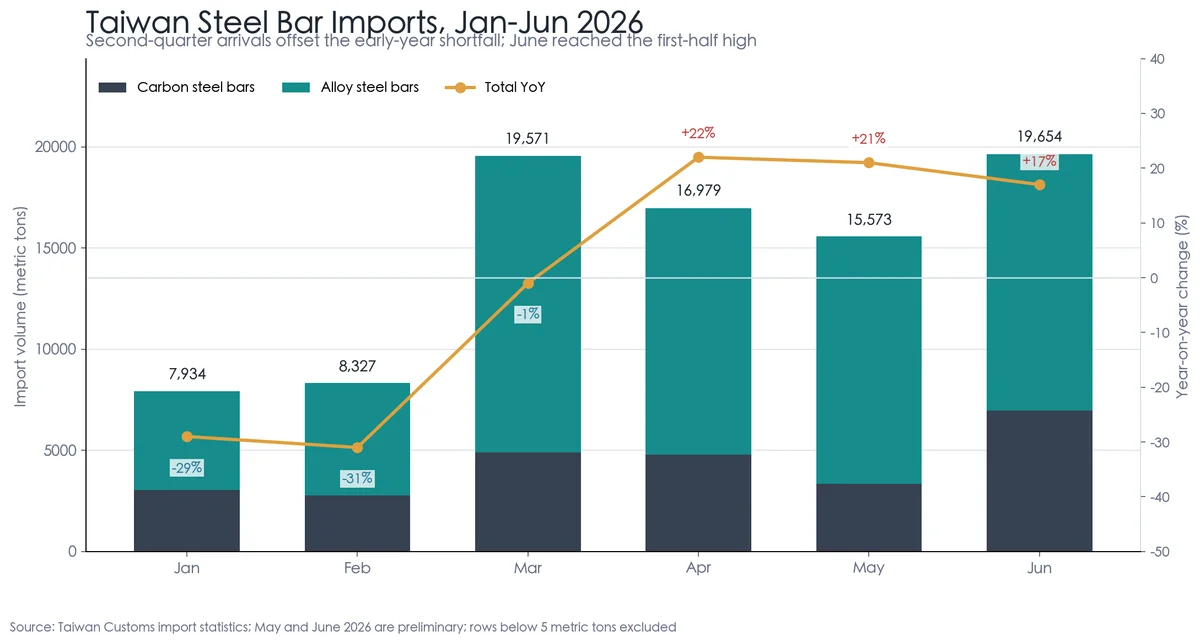
Combined imports reached 88,039 metric tons in the first half of 2026, compared with 86,442 metric tons in the same period of 2025, an increase of 2%. Volumes were down 29% year on year in January and 31% in February. From April through June, however, monthly imports exceeded year-earlier levels for three consecutive months, allowing second-quarter arrivals to recover the first-quarter deficit.
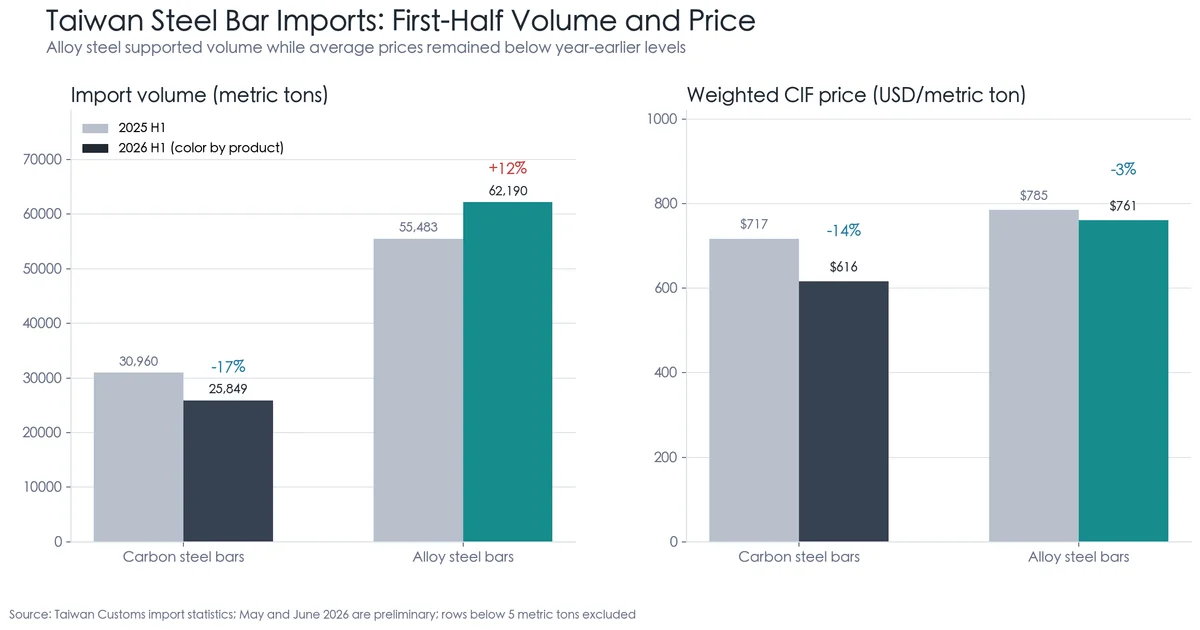
The price signal was less positive. The combined weighted CIF price declined from approximately USD 760 per metric ton in the first half of 2025 to USD 718 in 2026. Total import value fell from USD 65.719 million to USD 63.249 million, a decrease of about 3.8%. Higher volume accompanied by lower total value indicates that lower-priced supply and product-mix changes remained the dominant market forces.
(First-half import volume and price comparison)
Carbon versus alloy steel bars monthly comparison)
2. Carbon Steel Bars: Lower First-Half Volume and a Rapid Shift Toward China
Monthly Trend
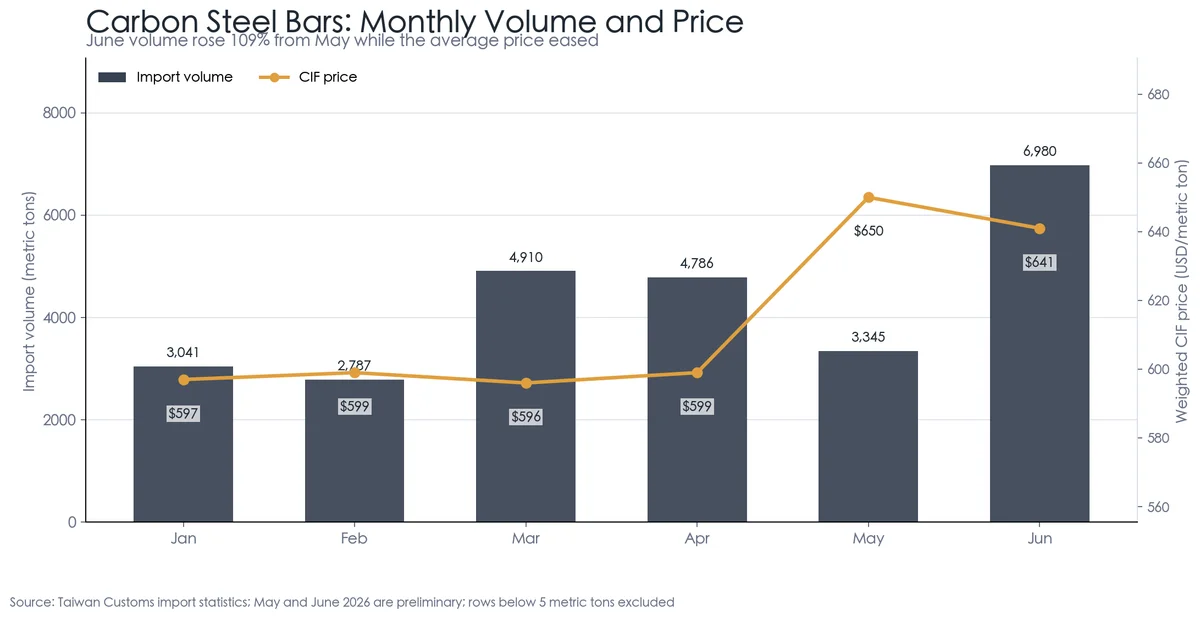
Carbon steel bar imports totaled 25,849 metric tons in the first half, down 17% year on year. The weighted CIF price averaged USD 616 per metric ton, down 14%. Prices remained in a narrow USD 596-599 range from January through April, increased to USD 650 in May, and eased to USD 641 in June.
(Carbon steel bars monthly volume and price)
June volume was 109% higher than in May and 73% above June 2025, interrupting the low-volume pattern observed during the first five months. Volume increased without a further rise in average price, however, so it remains necessary to distinguish stronger order demand from delayed cargoes or short-term restocking. A sharp decline in July would suggest that June was primarily a shipment-timing event. Continued high volume would provide stronger evidence of a change in inventory policy or underlying demand.
Shift in Import Origins
(Carbon steel bars origin, share, and CIF price comparison)
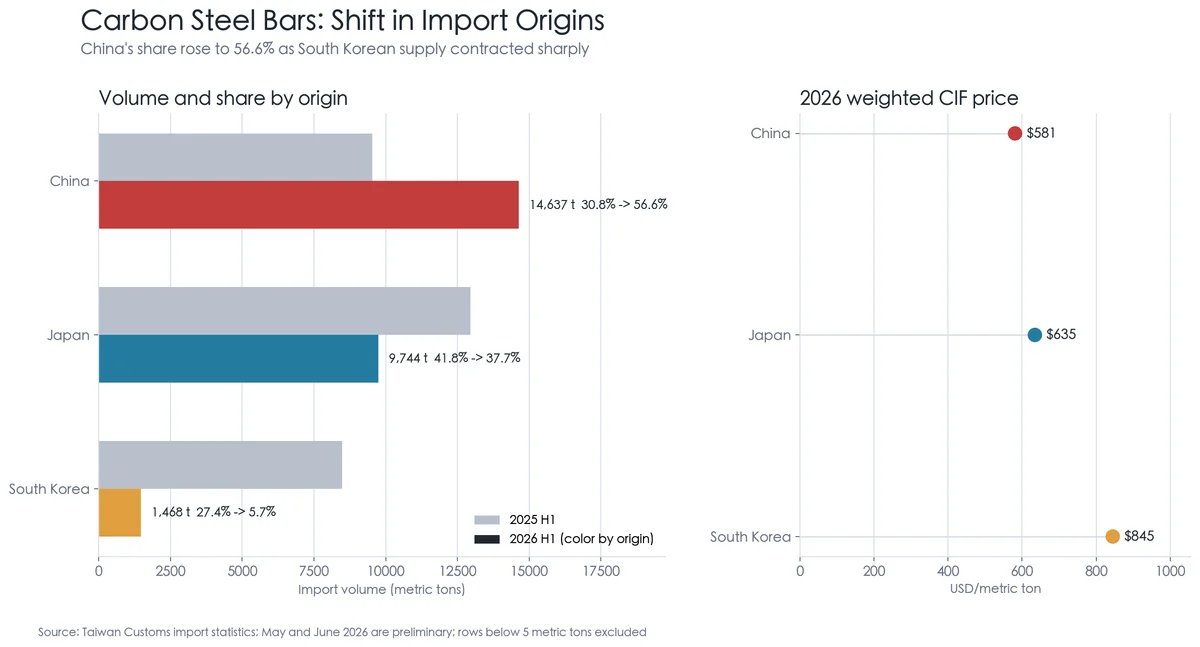
The most important development was not simply China's position as the largest source, but the speed of the supply-chain restructuring. China's carbon steel bar shipments to Taiwan increased by approximately 54% from the first half of 2025, while Japanese volume fell by about 25% and South Korean volume contracted by approximately 83%. China's share rose from 30.8% to 56.6%; South Korea's share dropped from 27.4% to only 5.7%.
China supplied 14,637 metric tons at an average price of USD 581 per metric ton, broadly unchanged from USD 585 a year earlier. Japan supplied 9,744 metric tons at USD 635 per metric ton, compared with approximately USD 820 in the first half of 2025. The Japan-China price gap therefore narrowed from about USD 235 to USD 54 per metric ton. Japan did not simply withdraw from the market; it used substantially more competitive pricing to preserve its position. Third-quarter competition will consequently depend not only on low-priced Chinese supply, but also on whether Japanese mills continue to quote aggressively.
3. Alloy Steel Bars: Sustained High Volume and a Major Increase from South Korea
Monthly Trend
Alloy steel bar imports reached 62,190 metric tons in the first half, up 12% year on year. They represented 70.6% of the combined volume covered by this report, compared with 64.2% a year earlier. The weighted CIF price averaged USD 761 per metric ton, down 3%.
January and February volumes were only 4,894 and 5,540 metric tons, respectively. Imports then jumped to 14,661 metric tons in March and remained between 12,193 and 12,674 metric tons from April through June. March initially could have been interpreted as delayed arrivals following the Lunar New Year period. Three additional months above 12,000 metric tons indicate that changes in sourcing, inventory strategy, or downstream orders should now be considered alongside one-time restocking.
Prices declined from USD 809 per metric ton in January to USD 722 in March, then recovered progressively to USD 796 in June. The low point appears to have passed, but the first-half average remained below the prior-year level, meaning the recovery has not yet reversed the broader price pressure.
(Alloy steel bars monthly volume and price0
Shift in Import Origins
 (Alloy steel bars origin, share, and CIF price comparison)
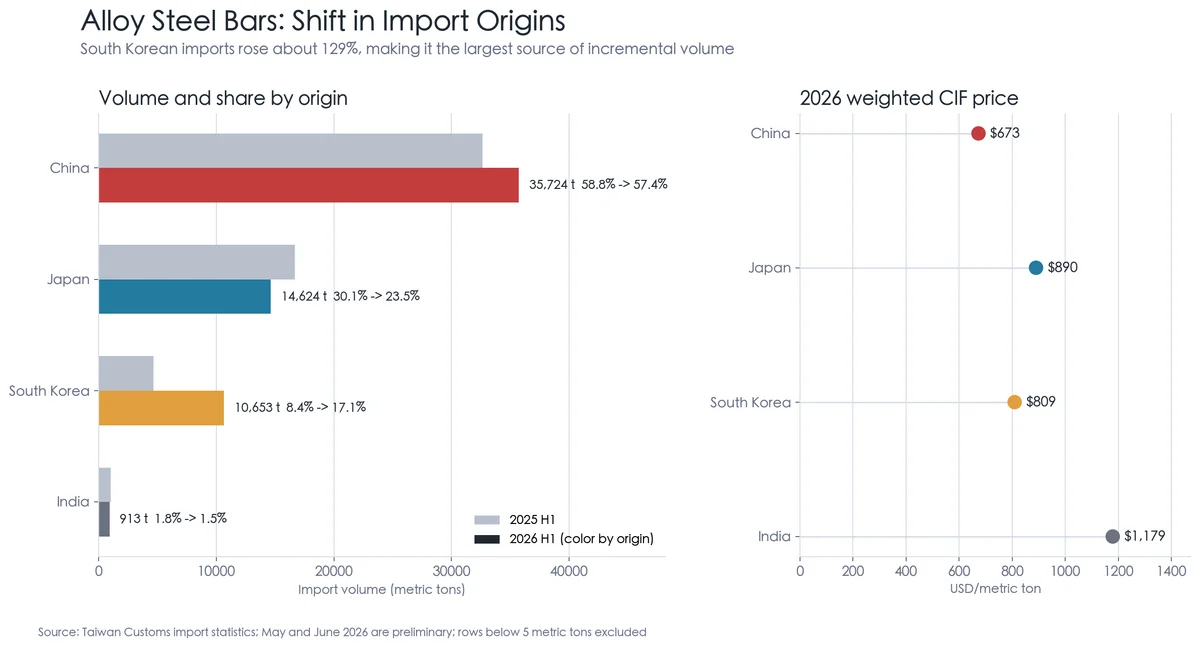
China remained the largest source, supplying 35,724 metric tons at an average CIF price of USD 673 per metric ton. Its volume increased by about 9%, while its share remained broadly stable at 57.4%.
South Korea was the more significant structural change. Shipments increased from 4,648 metric tons in the first half of 2025 to 10,653 metric tons in 2026, an increase of approximately 129%. Its share doubled from 8.4% to 17.1%. Japanese volume declined by about 12%, reducing Japan's share from 30.1% to 23.5%.
At USD 809 per metric ton, South Korean material occupied a price position between Chinese supply at USD 673 and Japanese material at USD 890. This combination of specification and price competitiveness appears to have created an effective middle tier. Of the 6,707-metric-ton increase in total alloy steel bar imports, South Korea contributed approximately 6,004 metric tons. If its share remains near 20%, the development should be viewed as a lasting supply-chain shift rather than a short-term restocking event.
4. Market Intelligence: Three External Variables
4.1 South Korean Anti-Dumping Investigation and Regional Trade Diversion
South Korea initiated an anti-dumping investigation in May covering Chinese hot-rolled carbon and alloy steel round bars. A preliminary determination was expected approximately three months after initiation. If new measures raise the cost of Chinese round bars entering South Korea, some Chinese supply could be redirected to Taiwan or other Asian markets, increasing low-price competition.
South Korea has simultaneously become Taiwan's most important source of incremental alloy steel bar volume. Any measure that strengthens the position of South Korean producers in their domestic market could also affect their export strategy toward Taiwan. Monitoring should therefore cover both Chinese offers and South Korean shipment volume and price differentials.
4.2 China Steel's Third-Quarter Increase Is Confirmed; Transaction Pass-Through Is the Next Test
China Steel Corporation and Dragon Steel raised third-quarter bar and wire rod prices by NTD 1,000 per metric ton, marking a second consecutive quarterly increase. The listed price of low-carbon wire rod also reached its highest level in nearly ten quarters. The direction of the mill price is no longer uncertain; the next question is whether downstream buyers will accept it.
Even with higher domestic list prices and firmer import offers in mid-June, round-bar transaction prices remained subject to discounts because domestic demand and export orders were weak. Wire rod prices rose after the announcement, but buying activity did not increase materially. If transaction volume fails to improve in the third quarter, the market may remain divided between firm mill list prices and soft actual transaction prices.
4.3 China's Summer Weakness and the Timing of Restocking
Chinese wire rod prices weakened through June, while export offers to Southeast Asia also declined from the beginning of the month. Softer iron ore prices and weak downstream orders continued to increase pressure from lower-priced Asian supply. Taiwanese importers therefore retained negotiating leverage, but lower prices also reflected weak demand and did not automatically create stronger purchasing interest.
The key third-quarter dividing line will be whether restocking emerges after the seasonal slowdown. A recovery in Chinese demand, mill production cuts, or a rebound in raw-material costs could close the current low-price purchasing window quickly. Continued inventory accumulation would instead leave Chinese and regional offers vulnerable to further declines.
5. Assessment and Outlook
Carbon Steel Bars
The current position can be summarized as lower first-half volume, a June shipment rebound, and a clear shift toward Chinese supply. June's higher volume is not sufficient by itself to confirm a demand recovery, but it has broken the low-volume pattern of the first five months. China's share reached 56.6%, while Japan narrowed its price premium substantially. Price competition may therefore be more important than aggregate volume during the third quarter.
The short-term view remains cautious. If July volume falls and transaction prices fail to improve, June should be treated as concentrated restocking. If volume remains elevated and the domestic mill increase passes through successfully, the evidence for demand recovery would be stronger.
Alloy Steel Bars
The current pattern is sustained high volume, a price recovery from the March low, and a sharp increase in South Korea's market share. Four consecutive high-volume months beginning in March can no longer be explained completely by delayed cargoes. South Korea's 129% volume increase was the most important origin-country development of the first half and warrants close monitoring for persistence and further displacement of Japanese material.
Chinese alloy steel bars remained approximately 24% cheaper than Japanese supply, continuing to pressure the market average. June's alloy steel bar price nevertheless recovered to USD 796 per metric ton. If prices remain near or above USD 790 while volume stays high, the product mix and demand profile may be improving. If volume remains high but prices fall again, supply competition and inventory pressure would be the more likely explanation.
Three Monitoring Indicators
1. Whether June's carbon steel rebound continues: July volume above approximately 6,000 metric tons would provide stronger evidence of a change in demand or inventory strategy.
2. South Korea's alloy steel share: Watch whether it remains near or above 17%, together with the price differential versus Japanese supply.
3. Mill-price pass-through and Chinese offers: Track actual transaction volume after China Steel's third-quarter increase and whether Chinese prices stabilize after the summer slowdown.
6. Conclusion
Taiwan's steel bar import market in the first half of 2026 was not simply a story of modest aggregate growth. Product mix and import origins changed materially. Carbon steel volume remained lower overall, but Chinese supply rapidly replaced South Korean share. Alloy steel imports stayed elevated, with South Korea becoming the largest source of incremental volume. Domestic mills raised list prices for a second consecutive quarter, yet import prices and spot transactions remained constrained by lower-priced supply and weak downstream demand.
The central third-quarter task is to distinguish demand-led restocking from supply-driven pressure. Rising volume, firmer prices, and improving domestic transactions would point to genuine demand recovery. Continued high import volume accompanied by renewed price weakness would instead suggest that regional trade diversion and inventory competition are intensifying.
---
This report is edited and compiled by Double Steel Co., Ltd, covers HS 72149920 and HS 72283000907. Weighted CIF prices are calculated by dividing aggregate import value by aggregate import weight. May and June 2026 figures are preliminary and may be revised. Market commentary is provided for trend analysis only and does not constitute purchasing advice.