
Source: Customs Administration, Ministry of Finance, Taiwan / Industry news
Published: October 12, 2026
Introduction: Lower Volume, Higher Unit Value — the Rise Came from Small High-Priced Lots
Taiwan imported a combined 15,789 MT of carbon steel round bar and alloy steel round bar in September 2026. Volume fell 22.8% from August's 2026 high but remained 20.4% above September 2025. Import value was US$11.883 million, down 21.6% month on month and up 25.9% year on year. The weighted CIF unit value rose 1.6% from US$741/MT in August to US$753/MT and was 4.6% above a year earlier.
Lower volume combined with a higher unit value can easily be read as "imports cooling while overseas offers strengthen." A breakdown by origin points to two specific changes instead. First, carbon steel round bar shifted from Chinese dominance to a roughly even split between China and Japan: Chinese cargo fell from 5,074 MT to 2,932 MT, while Japanese cargo rose from 1,904 MT to 3,042 MT. Second, the higher average was driven mainly by a small number of high-priced lots. Using average August-September weights, the total unit value increase of about US$12/MT consists of a positive source-mix effect of about US$25/MT and a negative within-origin effect of about US$13/MT. However, excluding 536 MT of high-priced cargo — Korean carbon bar plus Indian and German alloy bar, only 3.4% of September volume — the September average was about US$732/MT, slightly below August's US$736/MT on the same basis. The slight decline on this basis came mainly from a higher carbon bar share; within carbon bar, a higher Chinese unit value and a lower Japanese one largely offset each other, while alloy bar rose only about US$6/MT.
Customs data record the month in which cargo arrives. Given the usual three-to-four-month cycle of negotiation, production, and ocean freight for round bar, most September arrivals likely correspond to orders placed in May and June. CSC price announcements, Korea's preliminary anti-dumping decision, and overseas offers from September onward are leading indicators for arrivals around year-end and early next year.
1. September Volume Retreated from the Peak; Year-on-Year Growth Came Almost Entirely from Carbon Bar
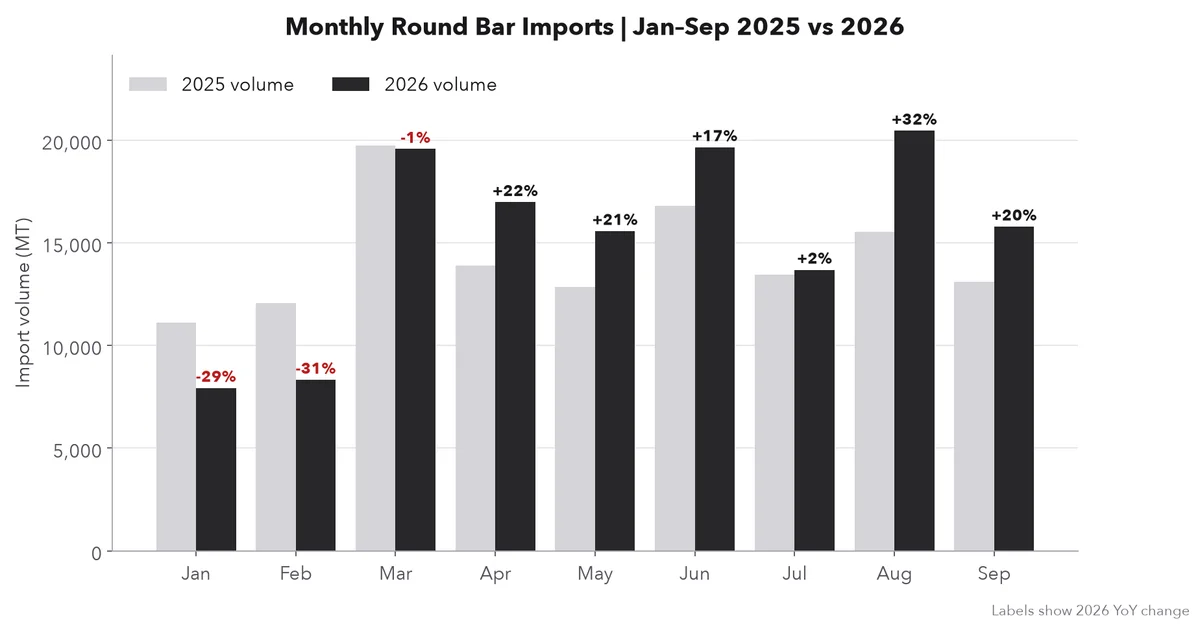
Combined volume fell 4,671 MT from August. Alloy steel round bar accounted for a decline of 3,836 MT and carbon steel round bar for 834 MT, so most of the decrease was in alloy bar.
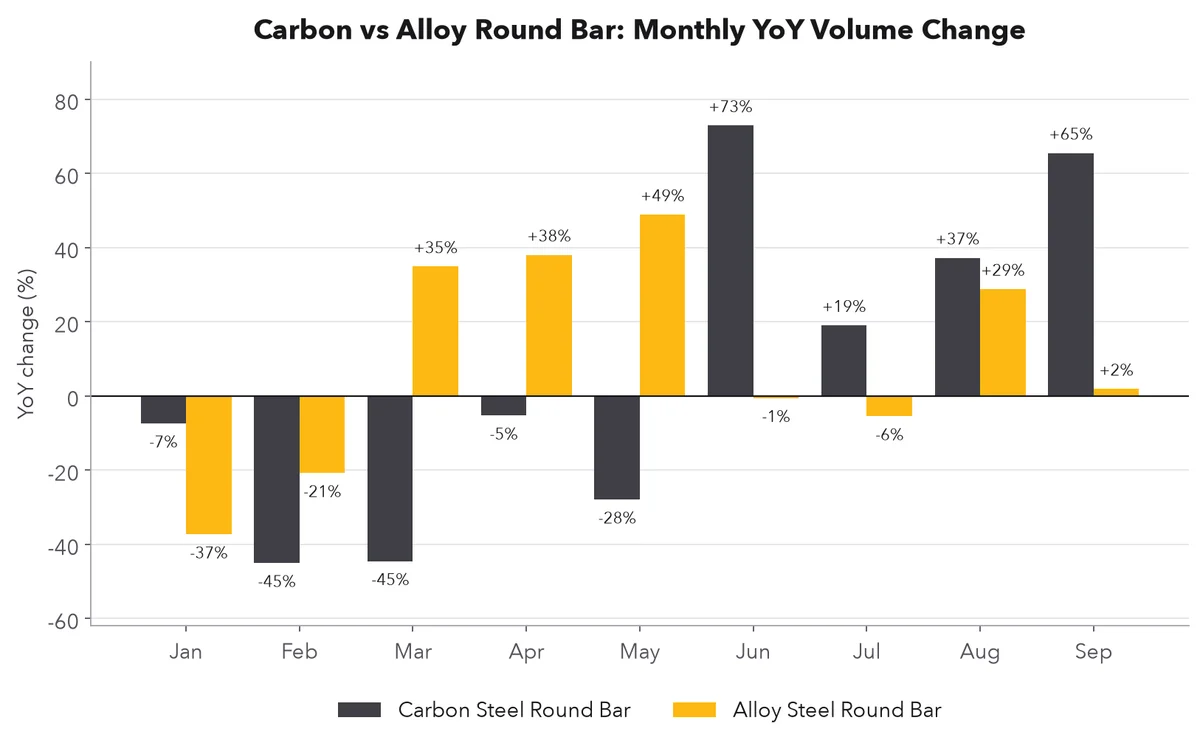
Compared with September 2025, volume rose 2,671 MT. Carbon bar increased 2,499 MT, while alloy bar rose only 173 MT. Within carbon bar, Japanese cargo contributed the largest year-on-year increase at 1,826 MT. September's year-on-year growth therefore did not reflect continued high alloy volumes; it reflected a rebound in carbon bar arrivals from a low base in September 2025.
The monthly pattern this year remains uneven. Volume fell about 30% year on year in January and February, rose 17% to 22% from April through June, grew only 2% in July, expanded to 32% in August, and returned to 20% in September. August's 20,460 MT now looks like a single-month peak caused by concentrated arrivals. September's decline is more likely a pullback after that concentration; arrival volume alone cannot determine the strength of end-use demand.
2. Source Mix and Unit Value: Small High-Priced Lots Lifted the Average
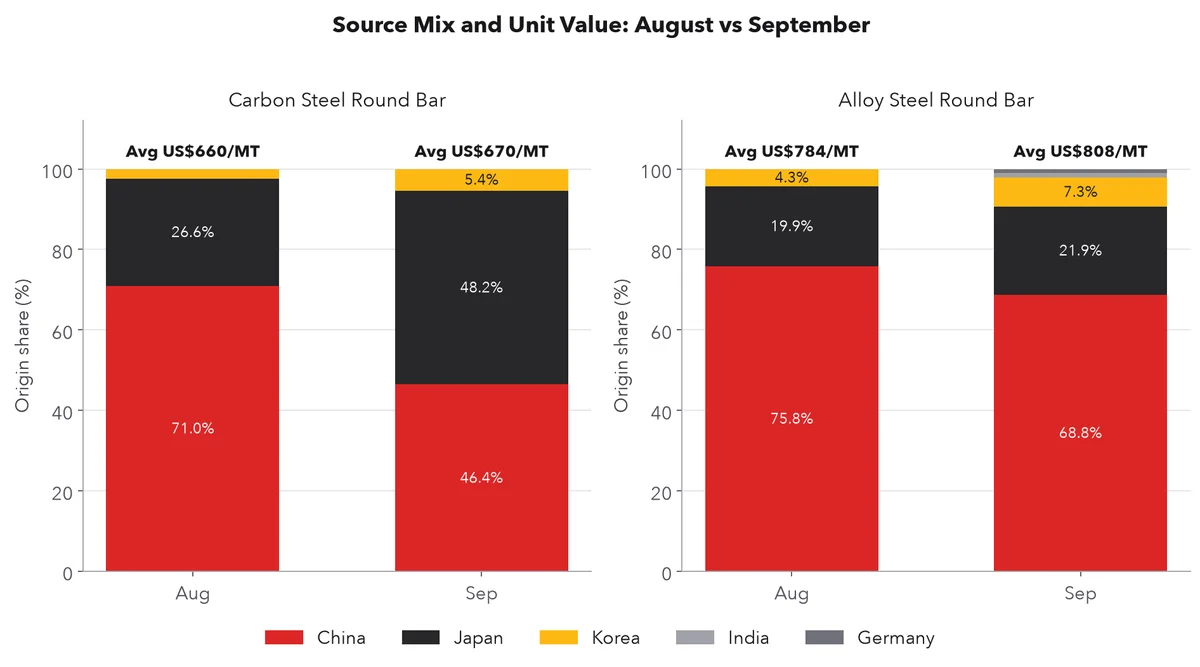
The carbon steel round bar unit value rose from US$660/MT to US$670/MT. Japan's share increased from 26.6% to 48.2% and China's fell from 71.0% to 46.4%. At the same time, the Japanese unit value fell from US$769/MT to US$648/MT, while the Chinese unit value rose from US$596/MT to US$635/MT. The upward pull from the China-Japan swap was largely offset by the lower Japanese unit value. Excluding 340 MT of Korean cargo at about US$1,153/MT, the carbon bar average edged down from US$643/MT to US$642/MT. The US$10/MT increase in the carbon bar average was therefore almost entirely due to a small, high-priced Korean volume.
The alloy steel round bar unit value rose from US$784/MT to US$808/MT. September included new arrivals of 105 MT from India and 91 MT from Germany, at about US$1,211/MT and US$2,148/MT respectively. Together they represented only 2.1% of alloy volume but were the main reason for the higher average. Excluding these two origins, the September alloy average was about US$790/MT, only US$6/MT above August. Chinese and Japanese alloy unit values were broadly unchanged, while the Korean unit value fell from US$895/MT to US$760/MT.
Among the main carbon bar origins, the China-Japan price gap is the more important trend to track. On a year-to-date basis, the premium of Japanese over Chinese carbon bar narrowed from about US$230/MT in January-September 2025 to about US$80/MT in 2026, and in September alone the gap was only US$13/MT. However, the monthly gap is volatile: it was about US$104/MT in July and US$173/MT in August, so September's convergence remains a single-month observation. The lower Japanese unit value in September may also reflect changes in specification and grade mix, which customs data cannot separate; it should not be read directly as a cut in Japanese offers.
3. January-September Comparison: Volume Up 7.3%, Weighted Unit Value Down 1.4%
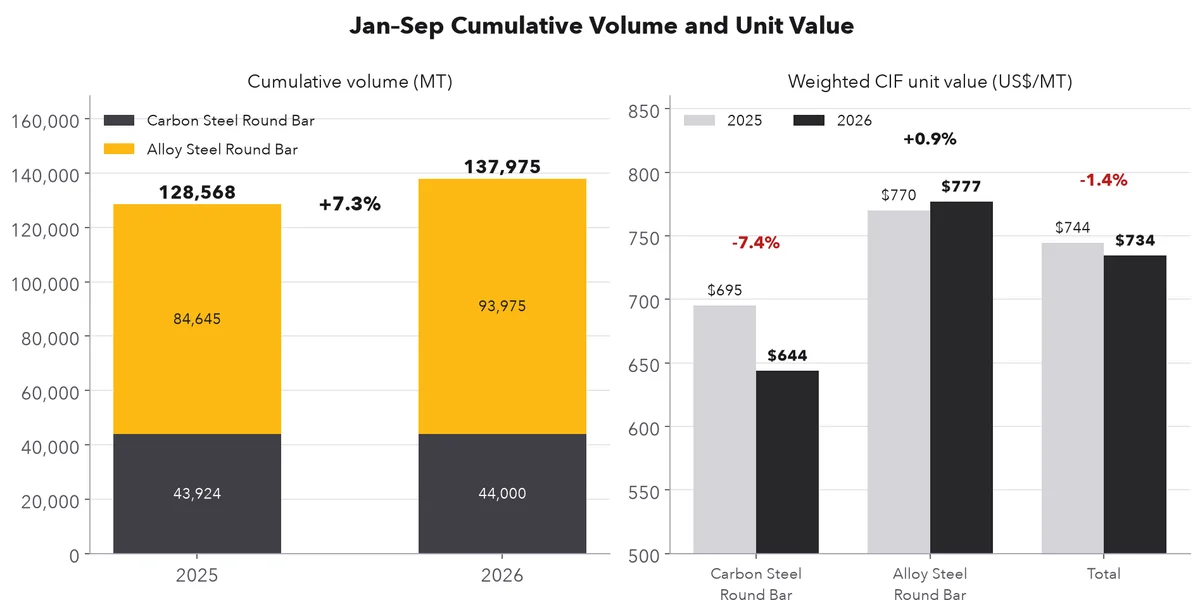
Taiwan imported 137,975 MT of the two round bar products in January-September 2026, up 7.3% from 128,568 MT in the same period of 2025. Import value rose 5.9% from US$95.715 million to US$101.325 million. The weighted CIF unit value fell 1.4% from US$744/MT to US$734/MT.
The product mix continued to shift toward alloy bar. Alloy steel round bar's share of total volume rose from 65.8% to 68.1%. Of the 9,406 MT increase in total volume, alloy bar contributed 9,330 MT and carbon bar only 76 MT. Cumulative growth widened from 5.8% in January-August, mainly because September carbon bar rebounded from last year's low base.
The two products moved in different price directions. The cumulative carbon bar unit value fell 7.4% from US$695/MT to US$644/MT, while the alloy bar unit value rose 0.9% from US$770/MT to US$777/MT. The higher alloy share supported the overall average but was not enough to offset the lower carbon bar unit value.
4. Carbon Steel Round Bar: China and Japan Nearly Even, Korea's Lost Volume Fully Replaced
Monthly Volume and Unit Value
Carbon steel round bar imports were 6,314 MT in September, down 11.7% month on month and up 65.5% year on year. The weighted CIF unit value was US$670/MT, up 1.5% month on month and 1.6% year on year. Chinese cargo totaled 2,932 MT at about US$635/MT. Japanese cargo totaled 3,042 MT at about US$648/MT, the second-highest monthly volume from Japan this year. Korean cargo was 340 MT; unit values for such small volumes should not be extrapolated.
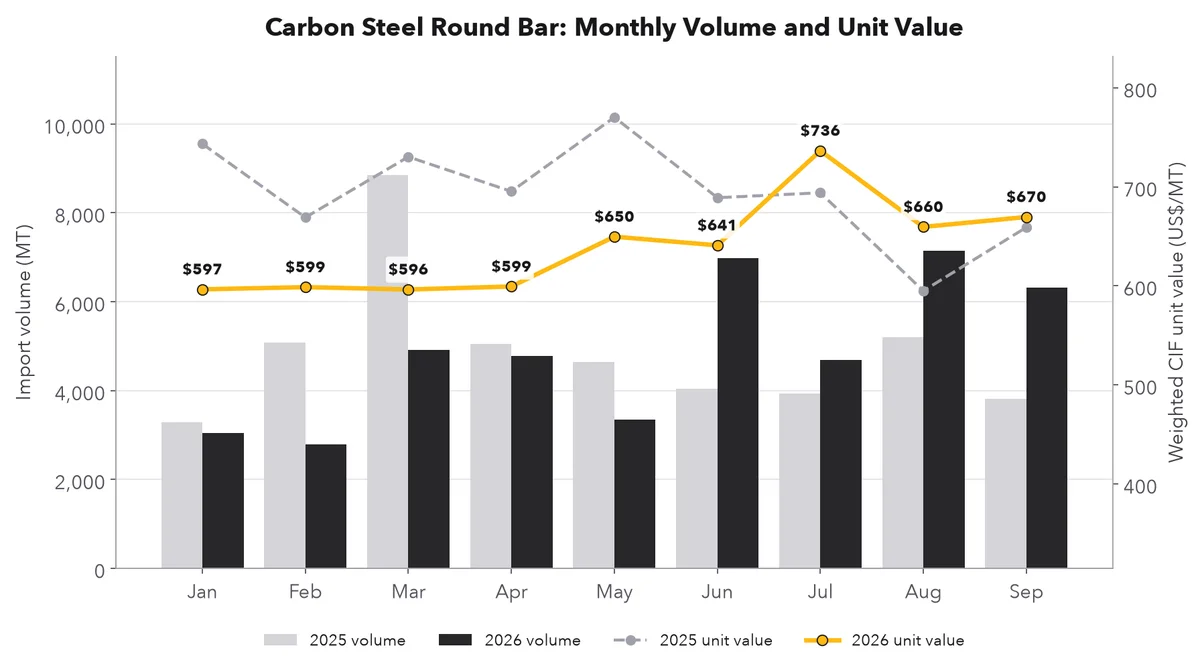
One market report can be compared with the drop in Chinese carbon bar. On September, industrial news cited sources saying that Chinese straight bar from Xiangtan Steel (S45C medium-carbon grade), originally scheduled to arrive in September at about CFR US$630-650/MT, had been delayed because flooding disrupted local transport. This is only one possible reason and has not been confirmed by another source. If accurate, part of the Chinese cargo would shift to October-November arrivals, and China's share could then recover.
Year-to-Date Origin Structure
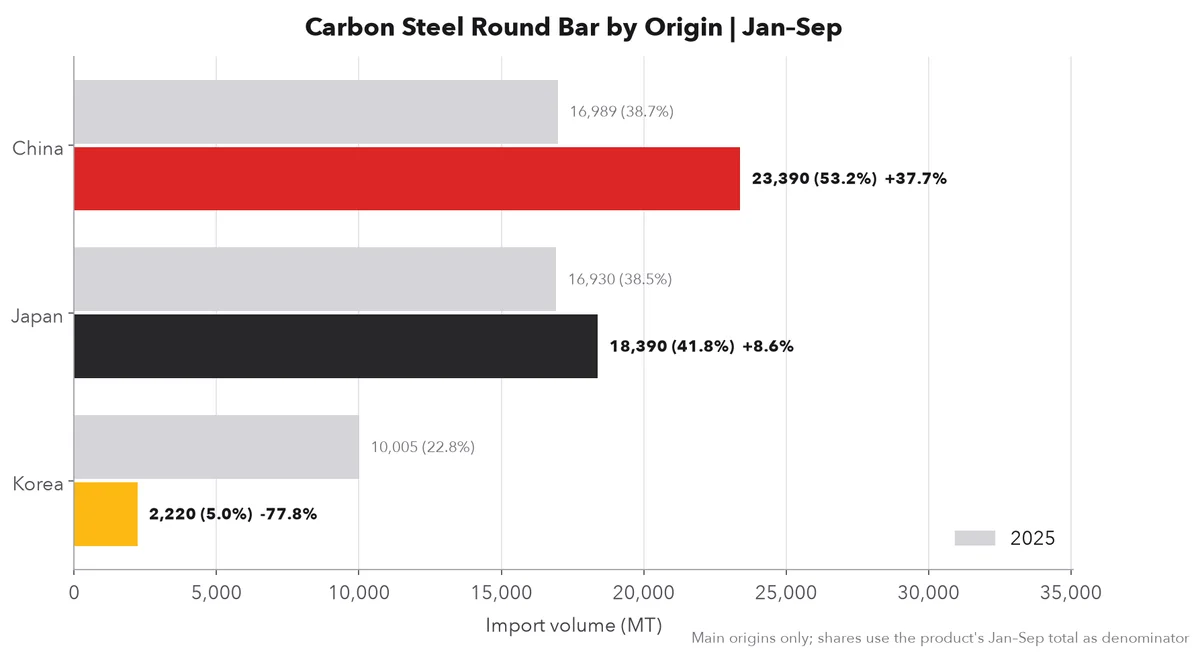
Carbon steel round bar imports totaled 44,000 MT in January-September, almost unchanged from 43,924 MT a year earlier. The origin structure, however, changed substantially. Chinese cargo rose 37.7% to 23,390 MT, lifting its share from 38.7% to 53.2%. Japanese cargo rose 8.6% to 18,390 MT, lifting its share from 38.5% to 41.8%. Korean cargo fell 77.8% from 10,005 MT to 2,220 MT, cutting its share from 22.8% to 5.0%.
Korea's 7,785 MT decline was fully replaced by a 6,401 MT increase from China and a 1,460 MT increase from Japan. Carbon bar volume did not shrink; Korea as a source did. China captured the largest increase with lower prices, while Japan expanded its share as the year-to-date price gap narrowed.
Unit Value Trends of the Top 3 Origins
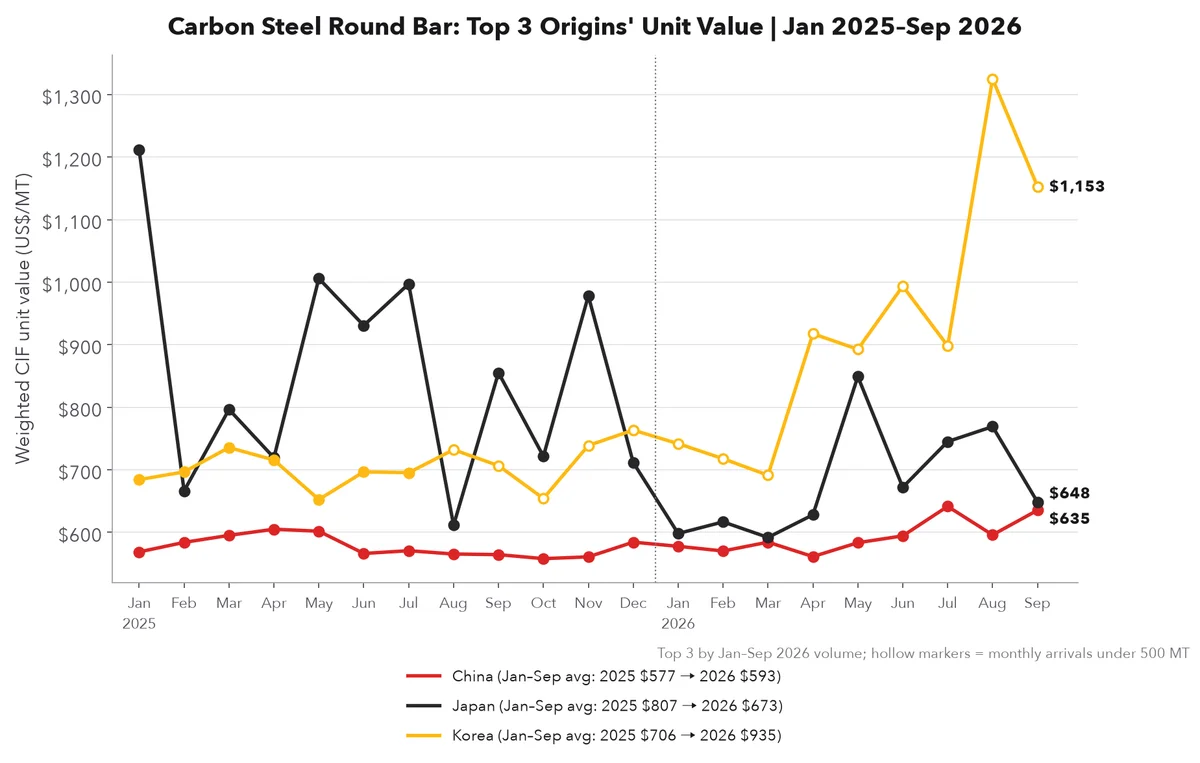
Chinese carbon bar was the most stable price anchor among the three main origins. From January 2025 to June 2026, its monthly CIF unit value stayed within US$558-605/MT; from July it shifted higher with more volatility, at US$642/MT in July and US$635/MT in September. The January-September cumulative unit value rose from US$577/MT to US$593/MT, up only 2.8%.
Japanese carbon bar showed the largest change. Its monthly unit value swung widely between US$612/MT and US$1,212/MT in 2025. In January-April 2026 it narrowed to US$592-628/MT, less than US$70/MT above Chinese cargo, then rebounded to US$672-849/MT in May-August before falling to US$648/MT in September. The January-September cumulative unit value fell from US$807/MT to US$673/MT, down 16.6%, the main driver of the narrowing cumulative gap with China noted above; comparing April-September alone, the gap also narrowed from about US$242/MT to US$107/MT. Customs data cannot separate lower offers from a shift toward lower-value specifications. However, the unit value distance to Chinese cargo narrowed markedly, coinciding with Japan's modestly higher share, which likely helped Japan gain share.
Korean carbon bar arrivals have been below 500 MT every month since August 2025. From April 2026 its unit value ranged from US$893/MT to US$1,325/MT, lifting the January-September cumulative unit value to US$935/MT. This reflects small, high-value lots rather than higher Korean offers for general carbon bar.
5. Alloy Steel Round Bar: Below 10,000 MT, but the Year-to-Date Growth Structure Is Unchanged
Monthly Volume and Unit Value
Alloy steel round bar imports were 9,474 MT in September, down 28.8% month on month and up 1.9% year on year. The unit value was US$808/MT, up 3.0% month on month and 8.5% year on year. Chinese cargo totaled 6,514 MT, or 68.8%, at about US$738/MT. Japanese cargo totaled 2,075 MT, or 21.9%, at about US$963/MT. Korean cargo totaled 689 MT, or 7.3%, at about US$760/MT. India and Germany together accounted for less than 200 MT.
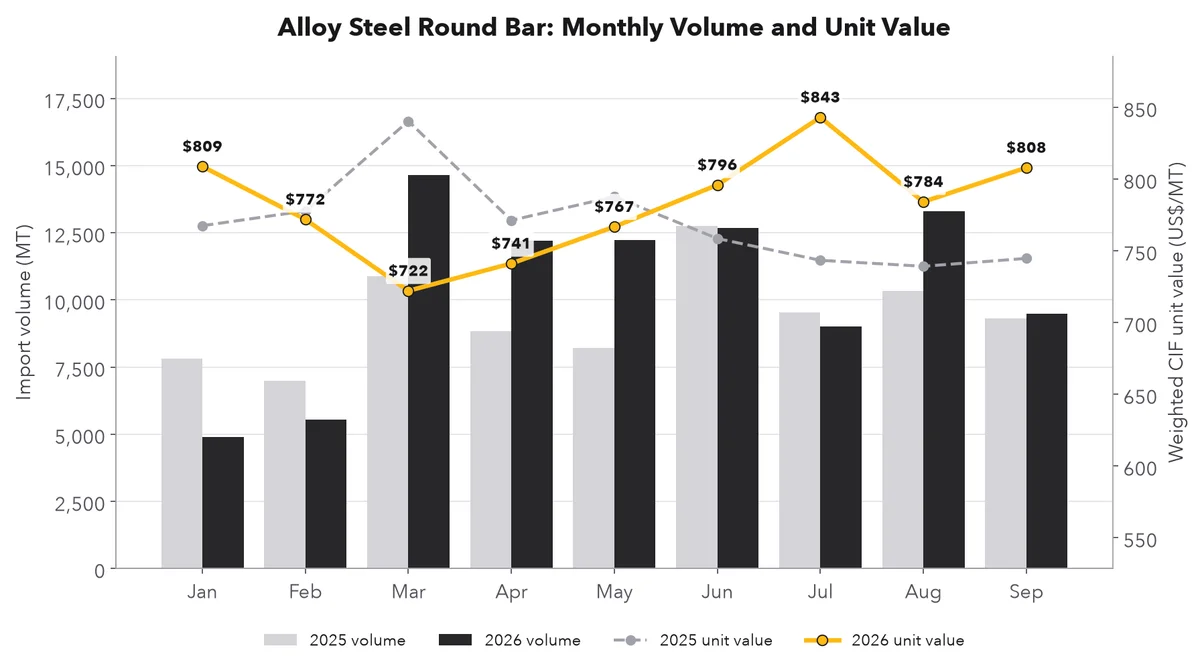
The previous report's test of whether alloy bar could hold above 10,000 MT was not met in September. After four consecutive months above 12,000 MT from March through June, volume was 9,000 MT in July, 13,311 MT in August, and 9,474 MT in September, alternating high and low since July. This looks more like an arrival rhythm shaped by concentrated orders and vessel schedules. The March-September monthly average was about 11,900 MT, but single months ranged from 9,000 MT to 14,700 MT, so neither the peaks nor the troughs should be extrapolated.
Year-to-Date Origin Structure
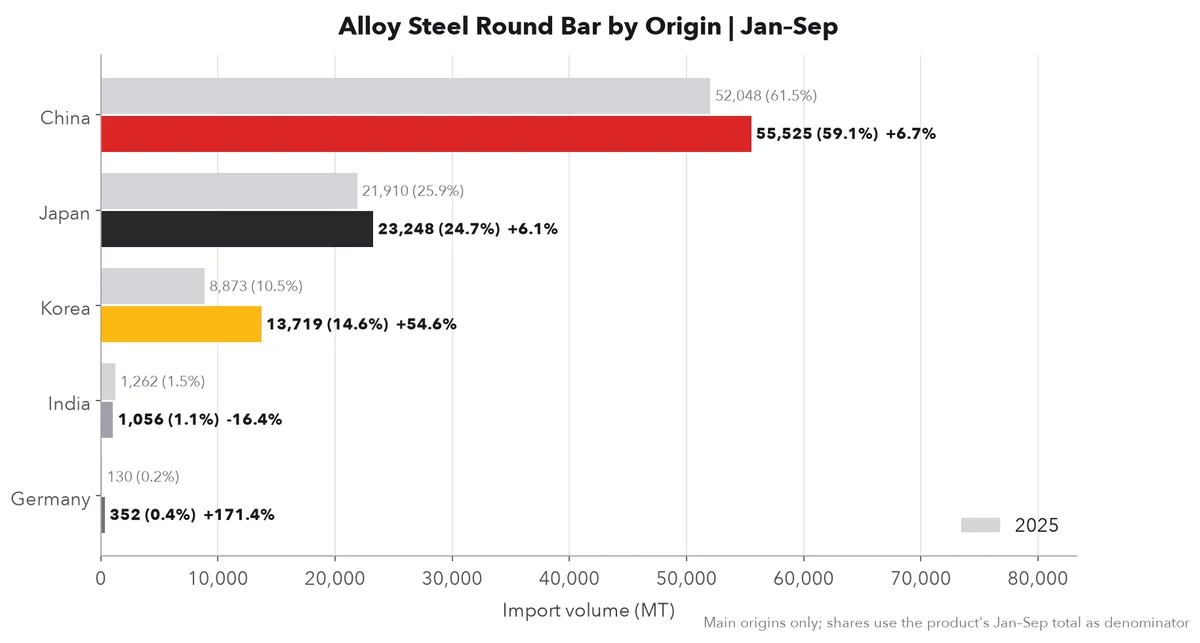
Alloy steel round bar imports totaled 93,975 MT in January-September, up 11.0% year on year. The cumulative unit value was US$777/MT, up 0.9%. Chinese cargo rose 6.7% to 55,525 MT, while its share fell from 61.5% to 59.1%. Japanese cargo rose 6.1% to 23,248 MT, while its share fell from 25.9% to 24.7%. Korean cargo rose 54.6% to 13,719 MT, lifting its share from 10.5% to 14.6%.
Of the 9,330 MT net increase in alloy bar, Korea contributed 4,846 MT, or about 52%; China 3,477 MT, or about 37%; and Japan 1,338 MT, or about 14%. Other origins combined were slightly negative, which is why the origin contributions add up to more than 100%. Korea pulled back sharply in carbon bar while expanding strongly in alloy bar — the clearest supply-chain change this year. However, Korean alloy bar was below 700 MT in both August and September, far below its January-July monthly average of about 1,800 MT, so the year-to-date increase was built mainly in the first seven months.
Unit Value Trends of the Top 3 Origins
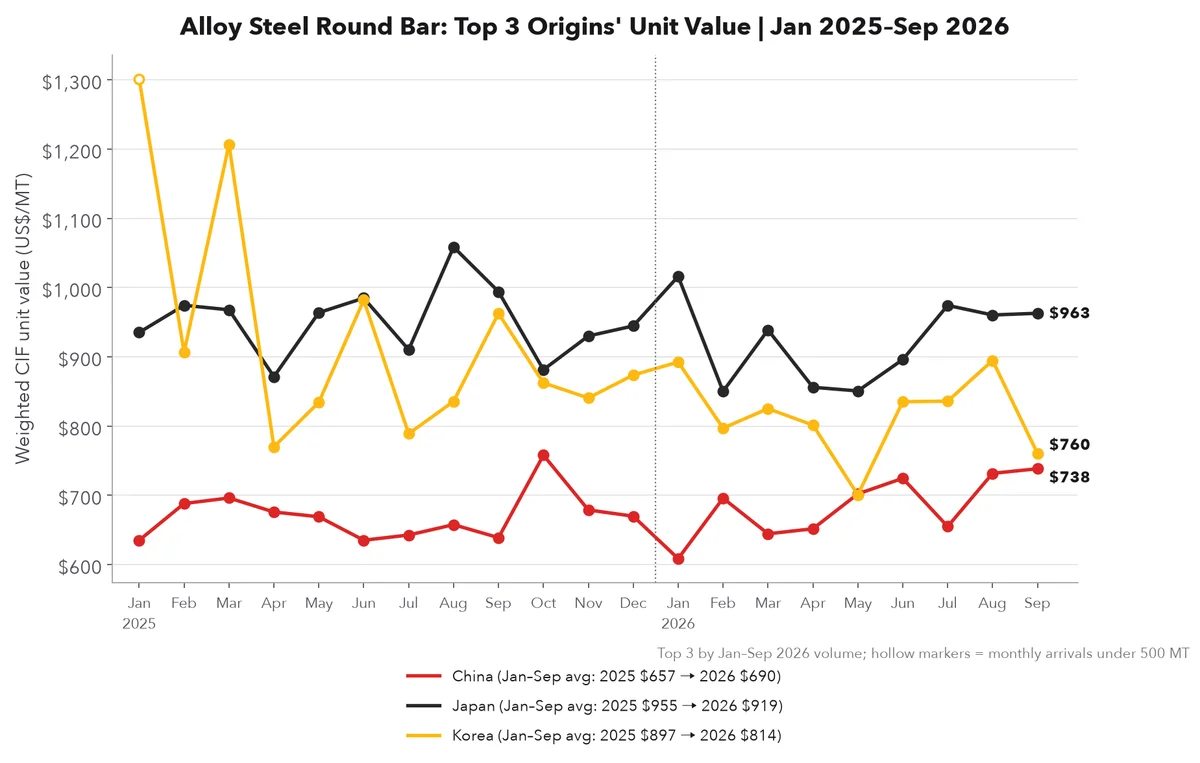
Among the three main alloy origins, China's unit value moved up while Japan's and Korea's moved down. China's January-September cumulative unit value rose from US$657/MT to US$690/MT, up 5.0%. Since May, every month except July (US$655/MT) has been above US$700/MT, and September's US$738/MT was the highest since October 2025 (US$758/MT). Japan's cumulative unit value fell from US$955/MT to US$919/MT, down 3.8%, but recovered to US$960-974/MT in July-September. Korea's cumulative unit value fell from US$897/MT to US$814/MT, down 9.3%.
Korea was both the largest contributor to cumulative alloy growth and the origin with the steepest unit value decline. The cumulative Korea-China gap narrowed from US$240/MT to US$124/MT; the two were almost level in May, and only US$22/MT apart in September. Smaller Korean arrivals in January-March 2025, including high-value months, inflated last year's base, but comparing April-September alone, the gap still narrowed from about US$199/MT to US$101/MT. The much narrower Korea-China gap compared with last year is likely one reason this year's alloy growth concentrated in Korea; customs data again cannot separate lower offers from a shift in specifications. However, with the gap at only US$22/MT in September, Korean arrivals were still below 700 MT, so the narrower gap has not yet translated into higher volume; whether the room for substitution widens depends on whether Korean arrivals recover in October-December.
6. Testing the Previous Report's Signals Against September Data
The January-August analysis set out three signals: whether China's high share would continue, whether alloy bar could hold above 10,000 MT, and whether the import pipeline would cool after CSC kept rod and bar prices flat. September data gave mixed answers. This report also tracks the latest progress in Korea's anti-dumping case on Chinese bar products.
1. China's High Share: Continued in Alloy, Interrupted in Carbon
China's share of alloy bar fell from 75.8% to 68.8% but remained above its 59.1% year-to-date level, so the Chinese-led structure continued. In carbon bar, China's share fell from 71.0% to 46.4%, and Japan again became the largest origin. The previous report also suggested that "if Japan's share rises again, the average could increase through the mix effect." In September, Japan's carbon bar share did rise and the average did edge higher, but the increase came mainly from small high-priced Korean cargo; the China-Japan swap was offset by the lower Japanese unit value. The predicted direction appeared, but through a different mechanism.
2. Alloy Bar Holding 10,000 MT: Not Met
Alloy bar volume was 9,474 MT in September, below the threshold. Year-on-year growth was still positive, however, and cumulative growth remained at 11%. The miss reflects the monthly arrival rhythm and is not enough to overturn the assessment of full-year alloy growth.
3. Import Pipeline After Flat Rod and Bar Prices: Consistent Direction, but the Timelines Do Not Yet Match
The retreat from the August peak is directionally consistent with a cooling import pipeline. However, September arrivals mainly reflect May-June orders and cannot be attributed to CSC's flat fourth-quarter rod and bar prices announced on September 4. This assessment still needs to be tested against arrival data for December through January.
4. Korea's Anti-Dumping Case on Chinese Bar: Now at the Preliminary Stage
According to a September 18 SteelWorld report citing Yonhap, Korea's Trade Commission decided on September 17 to recommend that the Ministry of Economy and Finance impose provisional anti-dumping duties of 25.08% to 27.96% on bar products originating in China (another report on the same day described this as a preliminary determination). The named suppliers include Daye Special Steel, Jiangsu Yonggang Group, and Singapore Jinteng International, and a final determination is expected in February next year. Another report translated the product covered by the same rates as "rebar." Whether the ministry has formally implemented the duties, and how the subject products map to the two HS codes in this report, still need to be confirmed against Korea's official notices.
The preliminary decision came after the ordering window for September arrivals, so any effect on Taiwan's arrivals would appear around December to January at the earliest. China's shares of alloy bar in August and September, at 75.8% and 68.8%, are close to 75.5% and 70.9% in the same months last year, so there is not yet evidence of Chinese cargo being diverted to Taiwan.
7. Market Context: Flat Products Rose, Rod and Bar Stayed Flat — Pass-Through Limited by Demand and Import Competition
Price announcements from September onward mainly affect new orders for arrival around year-end and early next year. They can be summarized into three signals.
Domestic rod and bar prices were flat across the board. On September 4, CSC and Dragon Steel kept fourth-quarter rod and bar prices and EAF Grade-A wire rod prices unchanged, ending two consecutive quarterly increases of NT$1,000/MT each. Feng Hsin and Wei Chih also kept their 509-round bar and rod prices flat, the fifth consecutive monthly flat setting for both. Wei Chih said demand remained weak while raw material costs had risen; industry analysis of Feng Hsin's flat price also pointed to no clear improvement in fastener and hand tool demand. Market participants said CSC's flat price mainly reflected the lack of improvement in export orders for fasteners and related industries, and still-low wire rod prices in China and Southeast Asia.
Most flat products rose, while rod and bar did not follow. On September 4, CSC also raised October prices for its main monthly flat products by NT$500-600/MT. On October 5, it announced a further NT$900/MT increase for November hot-rolled, cold-rolled, and hot-dip galvanized coil; industry sources said hot-rolled coil was additionally supported by US orders shifting to Taiwanese coating mills. November AP plate prices, however, were unchanged, so not all flat products rose. Under similar cost conditions, most flat products could raise prices while rod and bar stayed flat, indicating that pass-through in rod and bar is limited by both weak downstream demand and competition from lower-priced imported wire rod.
Asian wire rod and bar price increases paused. Ha Tinh Steel kept December-delivery wire rod prices unchanged after recent increases, citing iron ore falling from US$101/MT to about US$94/MT, a parallel decline in coking coal, and greater operating pressure on downstream users. Baosteel kept all November prices unchanged, including wire rod and bar. A Chinese assessment of the October special steel market noted limited upside for ordinary carbon structural and alloy structural steel, with demand mostly limited to inventory turnover.
Taiwan's round bar distribution market saw short-lived support. SteelWorld reported on September 9 that Chinese S45C straight bar at CFR US$630-650/MT translated into an import cost of about NT$21,500/MT, close to the NT$22,000/MT distribution price for imported spot material. Together with market talk of delayed Chinese cargo, this encouraged attempts to raise distribution prices. This support depends on the temporary absence of low-priced imports; if the delayed cargo arrives in a concentrated way in October-November, room for distribution price increases would narrow.
Overall, the rod and bar market combines stable domestic prices, paused Asian price increases, slightly softer raw materials, and still-weak end-use demand. Importers have little reason to chase prices to restock, and new orders are more likely to remain selective.
8. Outlook: Four Verifiable Signals
-
Whether Chinese carbon bar arrivals recover: If Chinese carbon bar returns to more than 4,000 MT per month in October-November and its share recovers to around 60%, this would better support the view that September reflected a short-term interruption from delayed cargo. The carbon bar average would also likely fall through the mix effect.
-
Whether alloy bar returns above 10,000 MT: If volume rebounds in October, the high-low arrival rhythm would be confirmed. If volume stays below 10,000 MT for two consecutive months, full-year alloy growth would need to be reassessed for signs of cooling.
-
Whether the Japanese carbon bar unit value stays near US$650/MT: If Japanese cargo continues to price close to Chinese cargo, Japan's carbon bar share could expand further and China's low-price substitution advantage would narrow.
-
China-Korea shares after the preliminary decision: Watch whether Korea's finance ministry formally implements the provisional duties, and whether China's alloy share and Korean shipments to Taiwan move in the same direction for two to three consecutive months from December through February.
9. Conclusion
Taiwan's round bar imports fell 22.8% in September from the August peak, while the unit value edged higher. This does not mean overseas offers strengthened across the board. Carbon bar shifted from Chinese dominance to a China-Japan split, but the Japanese unit value fell at the same time, largely offsetting the upward effect of the swap. The small increase in the average came mainly from small high-priced lots of Korean carbon bar and Indian and German alloy bar. Excluding these, the overall average was slightly below August, mainly because of a higher carbon bar share; within carbon bar, a higher Chinese unit value and a lower Japanese one largely offset each other.
For January-September, total round bar volume rose 7.3%, with almost all of the increase coming from alloy bar. Carbon bar volume was flat, but China and Japan fully replaced Korea. Alloy bar arrivals have alternated high and low since July, and year-to-date growth was built mainly in the first seven months.
The key for the rest of the year is where two timelines meet: whether the reduced Chinese carbon bar arrives in October-November, and how flat domestic rod and bar prices, paused Asian wire rod prices, and Korea's preliminary decision on Chinese bar show up in arrivals from December onward. With cost pressure in rod and bar but limited room for pass-through due to demand and import competition, import purchasing is likely to stay focused on destocking and selective orders.
Published by the Market Research Department of Double Steel Co., Ltd. This report is calculated from Taiwan Customs import statistics for HS 72149920 and HS 72283000907. Unit values are weighted CIF unit values calculated as import value divided by import weight. Records below 5 MT are excluded under the established methodology as de minimis, sample, or anomalous shipments. August and September 2026 figures are preliminary and may be revised. Year-on-year comparisons use the corresponding month and January-September period of 2025. The August-September unit value decomposition uses approximate two-period average weights to separate source-mix and within-origin effects: product-level decompositions are by origin, and the total decomposition is by product × origin, so the total mix effect also includes changes in the carbon/alloy split. Origins present in only one month are assigned entirely to the mix effect, and within-origin effects may include changes in specification mix. Customs months refer to arrival dates; market conditions are interpreted with a general three-to-four-month order-to-arrival lag, although actual timing varies by origin, specification, production, and shipping schedule. This market analysis is provided for trend assessment and does not constitute purchasing advice.